
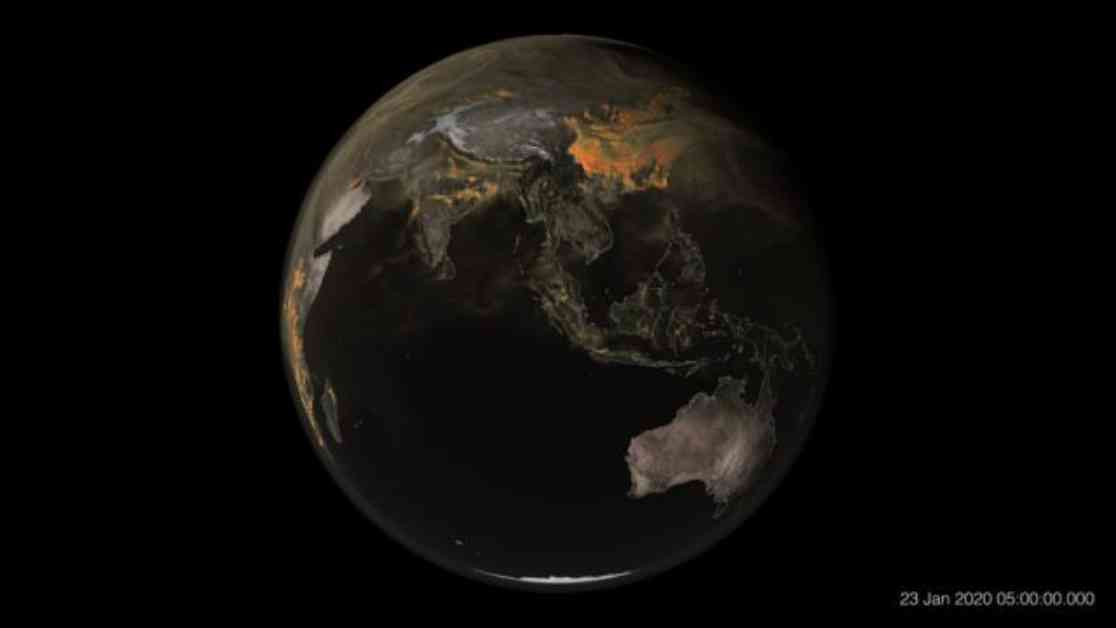
NASA recently released a global map showing concentrations of carbon dioxide in Earth’s atmosphere from January to March 2020. The map reveals how carbon dioxide moves through the atmosphere driven by wind patterns and atmospheric circulation. The high-resolution model allows viewers to zoom in and observe carbon dioxide emissions originating from power plants, fires, and cities as they spread across continents and oceans. Climate scientist Lesley Ott from NASA’s Goddard Space Flight Center emphasized the interconnected nature of different weather patterns and the impact of carbon emissions on the planet.
The majority of carbon dioxide emissions over China, the United States, and South Asia originated from power plants, industrial facilities, cars, and trucks. In contrast, emissions in Africa and South America were primarily due to fires related to land management, controlled agricultural burns, deforestation, and the burning of oil and coal. Fires release carbon dioxide as they burn, contributing to the overall concentration in the atmosphere.
The pulsing effect seen in the map is a result of two main factors. Firstly, fires exhibit a day-night cycle, intensifying during the day and decreasing at night. Secondly, the absorption and release of carbon dioxide by trees and plants during photosynthesis contribute to the pulsating pattern. Earth’s land and oceans absorb approximately 50% of carbon dioxide, with plants absorbing the gas during the day and releasing it at night through respiration. The data collected during the Southern Hemisphere summer show increased pulsing in regions with abundant trees, such as forests in the mid- or high latitudes.
The map was created using NASA’s high-resolution weather model called GEOS, which simulates atmospheric events like storm systems and cloud formations. The model utilizes data from ground observations and satellite instruments to provide detailed insights into the movement and density of carbon dioxide in the atmosphere. Understanding these patterns is crucial in addressing climate change and reducing the impact of greenhouse gas emissions on global temperatures.
Carbon dioxide is a significant greenhouse gas responsible for trapping heat in the atmosphere and contributing to rising global temperatures. The concentration of carbon dioxide has been steadily increasing since the industrial era, leading to warmer climate conditions and environmental changes. Human activities have been identified as the primary cause of this warming trend, resulting in more intense storms, wildfires, heat waves, and rising sea levels.
Visualizations like the one created by NASA help individuals comprehend complex environmental data and enable scientists to identify patterns and trends in carbon dioxide levels. By improving our understanding of greenhouse gases, researchers aim to develop models that can accurately predict future atmospheric conditions and guide sustainable environmental practices for the coming decades. The visualization serves as a powerful tool in conveying the impact of carbon dioxide emissions on Earth’s climate and the urgent need for mitigation strategies.


")

