
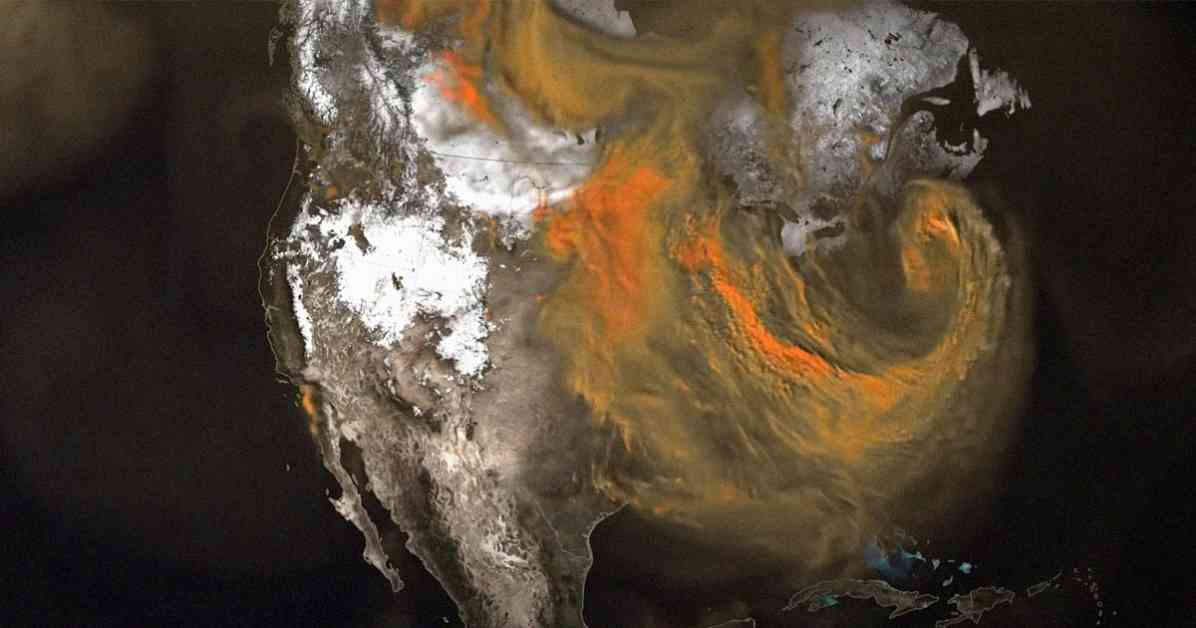
NASA has recently released a captivating new visualization that showcases the vast amounts of carbon dioxide being emitted into the atmosphere from various sources across the globe. The video, which spans from January to March 2020, provides a detailed look at how the gas moves through the atmosphere, driven by wind and atmospheric circulation.
One of the standout observations from the visualization is the significant contribution of carbon dioxide emissions from the United States. In 2021, the US accounted for over 12 percent of global emissions, second only to China, which made up nearly 33 percent of global emissions. The level of detail in the visualization allows viewers to zoom in and see carbon dioxide emissions rising from power plants, fires, and cities before spreading across continents and oceans.
NASA scientists are utilizing this data to not only identify major sources of greenhouse gases but also to study how these sources interact with one another. By understanding where carbon emissions originate and how they impact the planet, policymakers and scientists can make informed decisions to address human-driven climate change.
The visualization also highlights the different sources of CO2 emissions in various regions. In the US and China, heavy industries, power plants, cars, and trucks are major contributors. In Africa and South America, controlled fires for land management and deforestation play a significant role in carbon dioxide emissions. The mesmerizing patterns of CO2 emissions pulsing in the visualization reflect the ebb and flow of fires throughout the day, as well as the absorption and release of CO2 by plants and trees during photosynthesis.
To create this groundbreaking visualization, NASA utilized the Goddard Earth Observing System (GEOS), a supercomputer-powered model with a resolution that is more than 100 times greater than a typical weather model. This high resolution has provided scientists with an unprecedented look at the intricate interactions between CO2 emissions and weather patterns.
The lead climate scientist at NASA’s Goddard Space Flight Center, Lesley Ott, expressed the excitement of the scientific community at the opportunity to observe CO2 emissions in such detail. The visualization has revealed plume structures and interactions with weather systems that were previously unseen in coarser resolution simulations.
As we continue to grapple with the impacts of climate change, understanding the sources and movement of carbon dioxide in the atmosphere is crucial. By utilizing advanced technologies like the GEOS model, scientists can gain valuable insights into the factors driving human-driven climate change and work towards sustainable solutions for a healthier planet.


")


